All Practices Hard Tech Rebuild Adaptive Use EV & Microgrid

El Segundo  ·  Long Beach  ·  San Diego  ·  Palmdale

33.9192° N · 118.4165° W · Southern California advanced-manufacturing corridor

Production moves when the utilities move.

Decision Construction is the owner-side utility strategist for defense, aerospace, robotics, and data center campuses — integrating electric gas water sewer telecom into one phased plan so multi-megawatt facilities get energized on the production schedule.

ACT I — The blueprint · load, routing & feasibility on paper
ACT II — The intelligence · demand, GIS & scenario modeling
ACT III — The live campus · energized, monitored & in production
100 owner-side utility services across the full industrial lifecycle
5 sectors served — defense, aerospace, space, robotics & data centers
7 utility & agency fronts coordinated as one program — electric, gas, water, sewer, stormwater, telecom, air
6–18 mo of schedule a single utility misstep can cost an advanced-manufacturing campus

Figures reflect Decision Construction's service scope and typical program range.

01 — The Problem

A permitted plant is not an energized plant.

Standing up an advanced-manufacturing facility is not just a construction problem. It is a coordination problem. An owner can hold a signed lease, a design team, committed capital, and a full plan set — and still be unable to energize.

Most stakeholders focus on the building and the equipment. We focus on the invisible critical path beneath it — the utility service that decides whether the campus can actually run.

01 Manufacturer Blocked · equipment

Ready to install lines — stalled on transformer capacity, service voltage, meter location, and long-lead switchgear that was never ordered in time.

02 Developer / EPC Blocked · coordination

Crews ready to mobilize — but LADWP, SCE, SDG&E, SoCalGas, water, sewer, and telecom scopes and schedules are not aligned.

03 Lender At risk · timeline

Wants to fund the project — but lacks confidence in the true energization timeline and whether the site can carry the load on schedule.

04 Investor At risk · underwriting

Sees a strong industrial thesis — but cannot underwrite the hidden infrastructure cost and utility risk that decide site viability.

05 Program Lead Blocked · ownership

Owns the production ramp — but can't hold utilities, agencies, equipment vendors, and contractors together across a multi-year buildout.

This is where the campus stalls — and where we begin.

02 — Core Services

One firm. One hundred utility services.

Owner-side utility strategy and program management for defense, aerospace, robotics, and data center campuses — run as a live service catalog. Explore the full scope the way we manage it — an interactive board with Kanban, lifecycle Gantt, and grouped table views.

Service Catalog 100 services · 31 categories
{{ col.name }} {{ col.count }}
{{ card.id }} {{ card.family }}
{{ card.service }} {{ card.role }}
Category · lifecycle → {{ st.name }}
{{ r.name }} {{ r.count }}
{{ r.stageLabel }}
IDServiceStageBusiness value
{{ g.chevChar }} {{ g.name }} {{ g.count }}
{{ row.id }} {{ row.service }} {{ row.stageName }} {{ row.value }}
● utility-intelligence · defense · aerospace · robotics · data centers {{ svcViewLabel }} · 100 services

03 — Who We Serve

Utility readiness affects everyone. So do we.

Aerospace & Space

You are ramping to rate. Your utilities have to ramp with you.

Rate-production load models, phased energization, hangar and clean-assembly utilities, and coordination with LADWP, SCE, and SDG&E — so infrastructure tracks the production ramp.

Model your ramp →
Defense

Mission-critical production cannot wait on the grid.

Secure-facility utility coordination, standby generation, dual-feed feasibility, and continuity planning — managed so infrastructure work never threatens contract performance.

Protect continuity →
Lenders & Investors

A construction loan is only as strong as its path to energization.

Independent utility diligence, capacity evidence, cost and schedule risk, and readiness scoring — for sharper underwriting, structuring, and early warning on troubled projects.

See the intelligence layer →
Robotics & Advanced Mfg

Automation multiplies load faster than the service can grow.

Robotic-cell and factory-replication utility standards, demand modeling, and repeatable site-adaptation playbooks — so every new site comes online the same way.

Standardize your sites →
Data Centers & AI Compute

Compute is contracted in months. Power is delivered in years.

See data center services →

Three scopes on one accountable schedule: full facility design, utility power delivery from capacity screen to energized bus, and the OT security architecture tenants and insurers now require before turnover.

01 · DESIGNHalls, density, cooling, redundancy tier.
02 · UTILITY POWERInterconnection, substation, long-lead gear.
03 · CYBERSegmented BMS, EPMS, and SCADA zones.

04 — Coverage

Every utility that powers Southern California.

Southern California · excludes San Diego (SDG&E)

Electric · IOU

Investor-Owned

Southern California Edison (SCE)
Electric · Municipal (POU)

Publicly Owned

LA Dept. of Water & Power (LADWP) Anaheim Public Utilities Burbank Water & Power Glendale Water & Power Pasadena Water & Power Riverside Public Utilities Azusa Light & Water Colton Electric Utility Vernon Public Utilities Banning Electric Utility Rancho Cucamonga Municipal Utility Moreno Valley Utility (MVU) Cerritos Electric Utility
Natural Gas

Gas Distribution

Southern California Gas Co. (SoCalGas) Long Beach Energy Resources
Water · Wholesale

Water & Wholesale

Metropolitan Water District (MWD) LADWP Water System Municipal water & sewer districts Local fire / fire-flow authorities

05 — The Intelligence Layer

We are not observing the buildout. We are embedded inside it.

Every engagement produces structured knowledge: agency timelines, utility requirements, load and routing constraints, equipment lead times, delivery friction. Over time, that work becomes proprietary infrastructure intelligence.

Site-level readiness scoring, utility delay risk, CapEx forecasting, and program dashboards — for owners, EPCs, construction lenders, investors, and insurers.

Request an intelligence briefing
Campus utility readiness · sample Q3 2026
SITE-014 · El Segundo · Aerospace Service energized · in production A · Ready
SITE-021 · Long Beach · Space Switchgear on long lead B · Watch
SITE-063 · San Diego · Robotics SDG&E study in review B · Watch
SITE-047 · Palmdale · Defense Transformer capacity gap C · At risk
Illustrative sample — not client data

06 — Field Work

Where projects stall, and what happens next.

El Segundo · Aerospace

From a load number to an energized production line

A manufacturer scaling to rate faced open questions on service voltage, transformer strategy, and long-lead switchgear. We built the load package, led the SCE application, and sequenced procurement against the energization date.

→ A known path to power, and a schedule the team could commit to.

Inland Empire · Multi-site

One utility command center across a campus program

A developer with several concurrent buildings faced different service conditions and critical-path risk on each. We centralized the utility workflow, tracked every site, coordinated meter and service, and surfaced stalled agency actions early.

→ PMs stopped chasing utilities; buildings stopped sitting finished but dark.

San Diego · Robotics

Automation load that outran the existing service

A robotics operation adding production cells discovered its service could not carry the new load. We modeled the demand, coordinated the SDG&E upgrade, and staged energization so production kept moving throughout.

→ Expansion without a shutdown, and a repeatable standard for the next site.

Construction lender · Diligence

Underwriting what standard documents cannot reveal

A lender needed to see utility-related risk across a portfolio of industrial collateral. We provided site-level readiness, capacity evidence, bottleneck analysis, and delivery risk beyond what any appraisal shows.

→ Sharper underwriting, and earlier identification of at-risk projects.

Torrance · AI Compute

Twenty-four megawatts, and a date the board could defend

A compute operator held a signed offtake against a service that could carry a third of it. We phased the load into three interconnection stages, released the transformer and switchgear orders against the real critical path, permitted bridge generation with storage to turn the first hall on early, and designed the OT zones while the electrical package was still at 60%.

→ First hall revenue nine months ahead of permanent service, and a security package the tenant accepted at turnover.

07 — The Ask

The buildout will be won by the specialist who knows which campus can be energized.

We are seeking strategic conversations with partners who can help scale this field position into an industrial infrastructure-intelligence platform — while continuing to solve urgent utility problems for manufacturers, developers, and program teams.

Aerospace & space manufacturers Defense primes & suppliers Robotics & automation firms Data center & AI compute operators Industrial developers & EPCs Construction lenders & investors Insurance & risk analytics
Open a conversation

08 — Contact

Tell us about your site, campus, or program.

We respond with a grounded read: what your utility path looks like, where the risk is, and what has to happen next.

Email
Phone 310-448-1006
Address 15223 La Cruz, Pacific Palisades, CA 90272
Service area Los Angeles · El Segundo · Long Beach · San Diego · Greater Southern California
Site · Campus · Program · Portfolio

Two minutes now. A grounded read back.

Walk through our short project review — who you are, where the site is, and what's blocking you. We come back with what your utility path actually looks like, where the risk sits, and what has to happen next.

No commitment · reviewed by a consultant, not a bot

Core Services

One firm. One hundred utility services — across the lifecycle.

The complete owner-side utility scope for defense, aerospace, robotics, and data center campuses — strategy, service, permitting, construction, commissioning, and turnover. Browse the catalog as a Kanban board, a lifecycle Gantt, or a grouped table.

100 Utility services
31 Service categories
6 Lifecycle stages
4 Target sectors
Service Catalog 100 services · 31 categories
{{ col.name }} {{ col.count }}
{{ card.id }} {{ card.family }}
{{ card.service }} {{ card.role }}
Category · lifecycle → {{ st.name }}
{{ r.name }} {{ r.count }}
{{ r.stageLabel }}
IDServiceStageBusiness value
{{ g.chevChar }} {{ g.name }} {{ g.count }}
{{ row.id }} {{ row.service }} {{ row.stageName }} {{ row.value }}
● utility-intelligence · defense · aerospace · robotics · data centers {{ svcViewLabel }} · 100 services

How we run it

Every service maps to a lifecycle stage.

Strategy & Siting → Diligence & Feasibility → Design & Application → Procurement & Construction → Commissioning & Energization → Operations & Advisory

Built for

Five hard-tech sectors.

Defense

Secure-facility coordination, standby generation, and mission-critical continuity.

Aerospace

Rate-production ramps, hangar and integration-facility utilities, phased energization.

Space

Clean-assembly power, environmental control, gases, vacuum, and resilient backup.

Robotics

Robotic-cell standards, factory replication, and demand that scales with automation.

Data Centers

Interconnection, substation delivery, full facility design, and OT security.

Not sure which path fits?

Tell us where your project stands — we'll tell you what the utility path looks like from there.

← ALL SERVICES

{{ svc.eyebrow }}

{{ svc.titleA }}{{ svc.titleAccent }}

{{ svc.lede }}

{{ st.n }} {{ st.t }}

Why it matters

{{ svc.whyTitle }}

{{ para.t }}

Scope

What we take off your plate.

✓ {{ inc.t }}

{{ svcTipTerm }}

{{ svcTipDef }}

The Path

How it unfolds.

{{ step.n }}

{{ step.t }}

{{ step.d }}

“{{ svc.quote }}”

{{ svc.ctaTitle }}

{{ svc.ctaText }}

For Data Centers · Hyperscale · Colocation · AI Compute · Edge

The building is the easy part. The power is the project.

A campus can have land, fiber, water, and a signed offtake — and still sit dark because the interconnection queue, the substation, and the switchgear lead times run longer than the build. We plan the whole thing as one system: full data center design, utility power delivery, and the OT security that tenants, insurers, and regulators now want proven before energization.

Request a power & design review See the interconnection path →

The Data Center Challenge

Compute is contracted in months. Power is delivered in years.

The design team optimizes the hall. The utility runs a study. Procurement fights a 92-week transformer. The security team arrives after the controls are already installed. Each group is competent and each is working from a different schedule — and the ready-for-service date is the one thing none of them owns.

interconnection queue position substation capacity & land transformer & switchgear lead times liquid cooling & water rights generator & fuel air permits rack density outrunning the design flat OT networks & vendor access commissioning compressed to nothing ready-for-service date: unowned

The Data Center Intelligence Hub

Every campus, measured in megawatts delivered.

Contracted load against energized load, interconnection stage, design completion, long-lead equipment, cyber authorization, and the ready-for-service date — one row per campus, rolled up for the board.

What We Deliver

Three scopes, one accountable schedule.

01 · DESIGN

Full data center design

Civil, structural, electrical, mechanical, fire, security, and controls — managed as one coordinated package from siting through as-builts, with density and redundancy decided before they become change orders.

▸ Hall layout, density & growth phasing ▸ Tier / concurrent maintainability ▸ Liquid cooling & heat rejection ▸ Constructibility & equipment access
02 · UTILITY POWER

Utility power delivery

Owner-side interconnection from the first capacity screen to the energized bus — applications, studies, LOAs, substation and duct bank scope, long-lead equipment, and the phased energization that protects the RFS date.

▸ Capacity screening & site selection ▸ Interconnection applications & studies ▸ Substation, ductbank & switchgear ▸ Generation, storage & bridge power
03 · CYBER SECURITY

Cyber & OT security

The building systems are the attack surface. We architect segmented zones for BMS, EPMS, and SCADA, control vendor access, and carry the evidence through commissioning to an authorization tenants and insurers accept.

▸ IT / OT segmentation & zone design ▸ IEC 62443 · NIST 800-82 · NERC CIP ▸ Remote & vendor access control ▸ Monitoring, response & audit evidence
01 · IN DEPTH

Design decisions, priced in megawatts

Rack density, cooling method, and redundancy tier set the electrical service, the generator yard, the water demand, and the permits. We hold all seven disciplines against one model so a density change shows up as a schedule and capacity consequence the same week it is proposed — not at 90% CD.

02 · IN DEPTH

The interconnection is the schedule

Screening, application, system study, letter of authorization, substation, switchgear, energization — each with an owner, a date, and the equipment order that has to release to protect it. We also model the bridge: temporary generation and storage that turn the first hall on while the permanent service is still being built.

03 · IN DEPTH

The building systems are the attack surface

Chillers, switchgear controls, EPMS, BMS, access control, and every vendor laptop that touches them. Security designed at 60% CD costs a fraction of security retrofitted after turnover — and it is now the item that holds up tenant sign-off. We architect the zones, control the access, and carry the evidence into commissioning.

Platform Capabilities

Twelve capabilities, tuned for compute campuses.

F-01Load & Capacity ModelingRack to substation, phased hall by hall.
F-02Interconnection ProgramApplications, studies, LOAs, queue position.
F-03Substation & SwitchgearOwner-side scope from study to energization.
F-04Full Design ManagementSeven disciplines, one coordinated package.
F-05Cooling & Water StrategyLiquid, air, and reuse — modeled against permits.
F-06Resiliency & RedundancyN+1 to 2N, concurrently maintainable paths.
F-07OT / ICS Cyber ArchitectureSegmented zones for BMS, EPMS, and SCADA.
F-08Compliance & AuthorizationIEC 62443, NIST 800-82, NERC CIP where it applies.
F-09Long-Lead ProcurementTransformers, switchgear, gensets, chillers.
F-10Commissioning Lv 1–5Scripted, witnessed, documented to turnover.
F-11Evidence RepositoryAudit-ready records for tenants and lenders.
F-12API & System IntegrationDCIM, EPMS, BMS, GIS, and utility portals.
Consulting Behind the Software

Owner-side people in every room that sets the date.

Utility planning meetings, AHJ reviews, factory witness tests, commissioning scripts, and security audits — we sit on your side of the table and bring the record back into the platform.

✓ Site power feasibility & screening ✓ Interconnection strategy & filings ✓ Substation & ductbank coordination ✓ Full design management ✓ Cooling & water permitting support ✓ Long-lead equipment procurement ✓ Generator & fuel air permitting ✓ OT / ICS security architecture ✓ Cyber compliance & audit readiness ✓ Commissioning management Lv 1–5 ✓ Tenant & lender reporting ✓ Executive briefing support

Value by Stakeholder

One picture, read eight different ways.

Hyperscale Operators

Which campuses hold their RFS date, and which need a bridge-power decision now.

Colocation Providers

Sellable capacity by hall, with the utility path behind every commitment.

AI Compute Builders

Density changes priced in megawatts and weeks before they are committed.

Utilities

Complete, consistent submittals and a single counterpart across the campus.

Lenders & Investors

Draws tied to energization and commissioning evidence, not percent complete.

Insurers

Documented resiliency and OT security posture ahead of binding.

EPC & Design-Build

One coordinated design intent and a clear long-lead release calendar.

Enterprise Tenants

A defendable delivery date and a security package they can actually accept.

Design, power, and security — planned as one schedule.

Know your real energization date, order the long-lead equipment in time to hold it, and hand tenants a commissioned, segmented, documented facility.

For Site Selection For Builders For Investors For Agencies

{{ utilitySub }}

Page view reserved — send over the copy and materials for this audience and we'll design it in.

{{ utilitySub }} — hero & positioning (content to be provided)
{{ utilitySub }} — services & proof (content to be provided)

Site Selection · Utility-Led Screening

Pick the site the utilities can actually serve.

Before you commit to a lease or acquisition, we screen candidate sites on utility deliverability — capacity, territory, upgrade risk, and time-to-power — and turn a dozen unknowns into one comparable decision.

Screen your candidate sites 4 deliverables below ↓
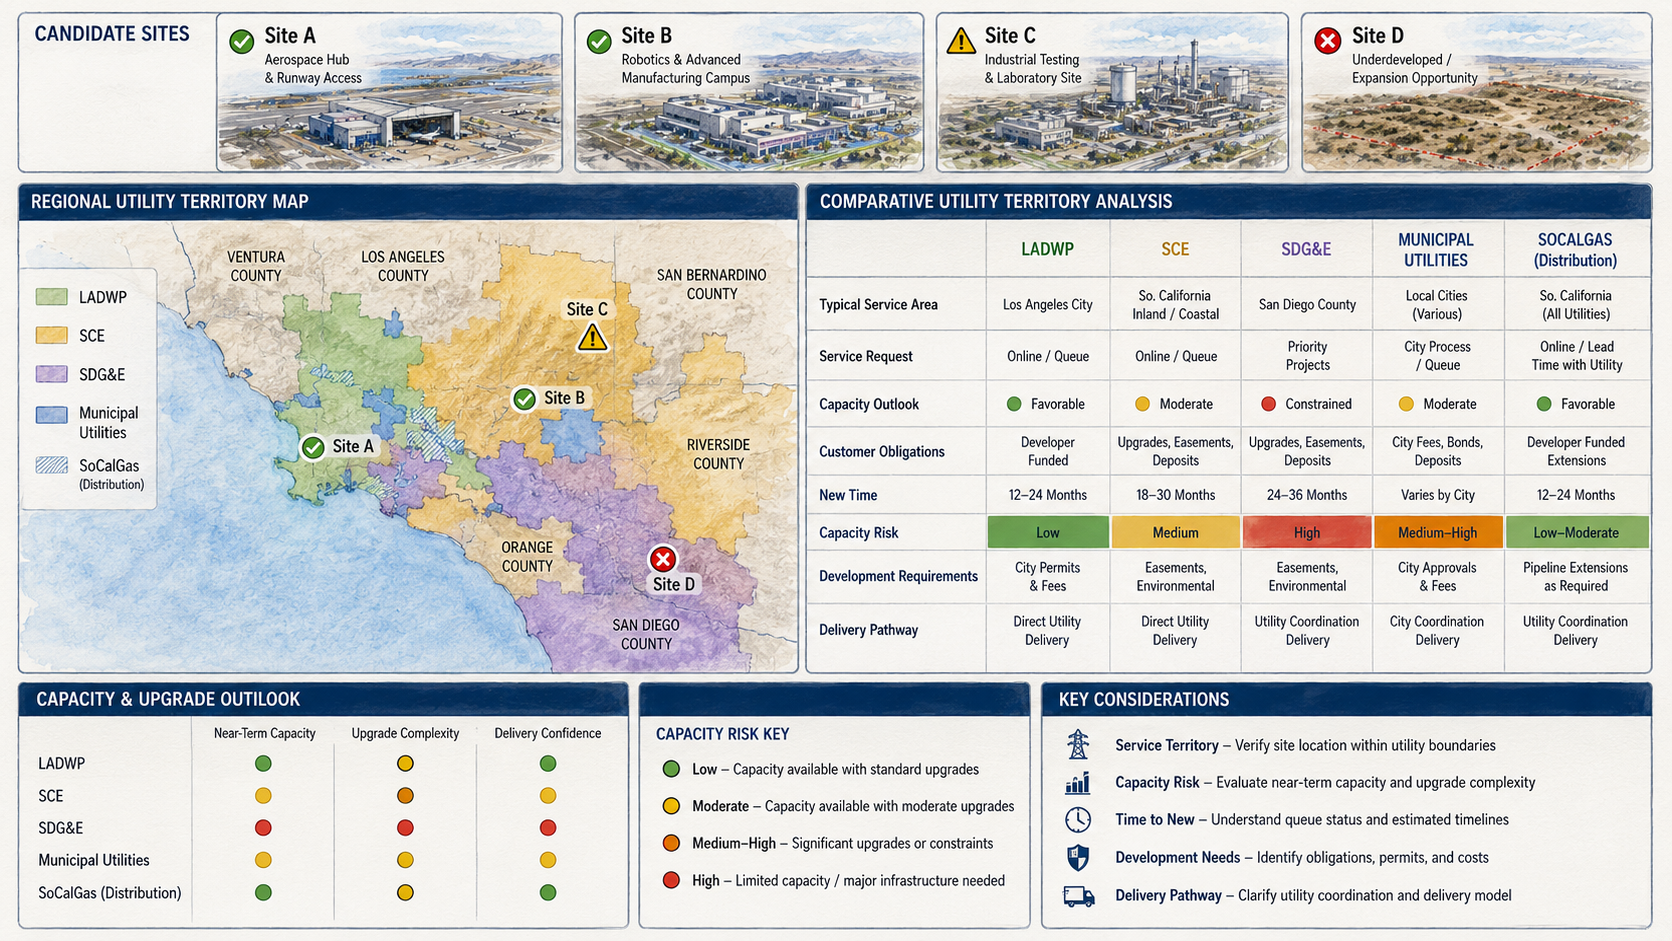
01 · Territory

Comparative Utility Territory Analysis

LADWP, SCE, SDG&E, municipal utilities, and SoCalGas — compared side by side on service area, capacity outlook, customer obligations, time-to-power, and delivery pathway.

LADWP SCE SDG&E SoCalGas
Regional utility territory map and comparative territory analysis for four candidate sites
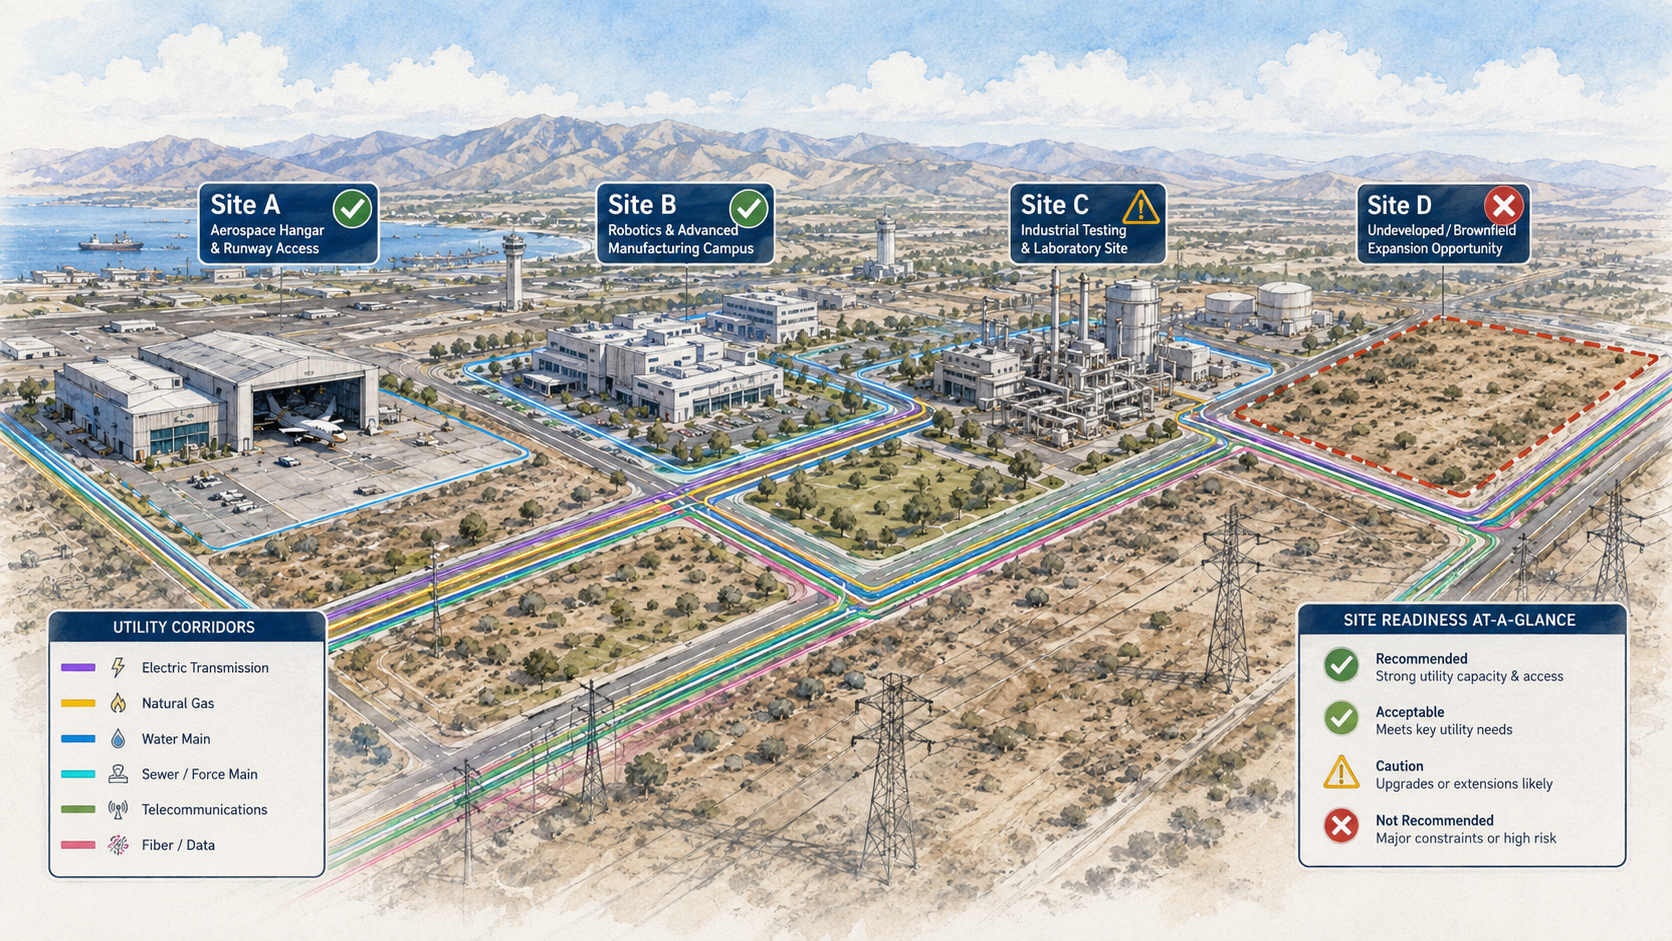
02 · Corridors

Utility Corridor & Site-Readiness Plan

Electric, gas, water, sewer, telecom, and fiber corridors mapped across every candidate parcel — with a readiness verdict for each site at a glance.

Electric Gas Water Sewer Telecom Fiber
Aerial utility corridor site plan with electric, gas, water, sewer, telecom and fiber routing and site readiness legend
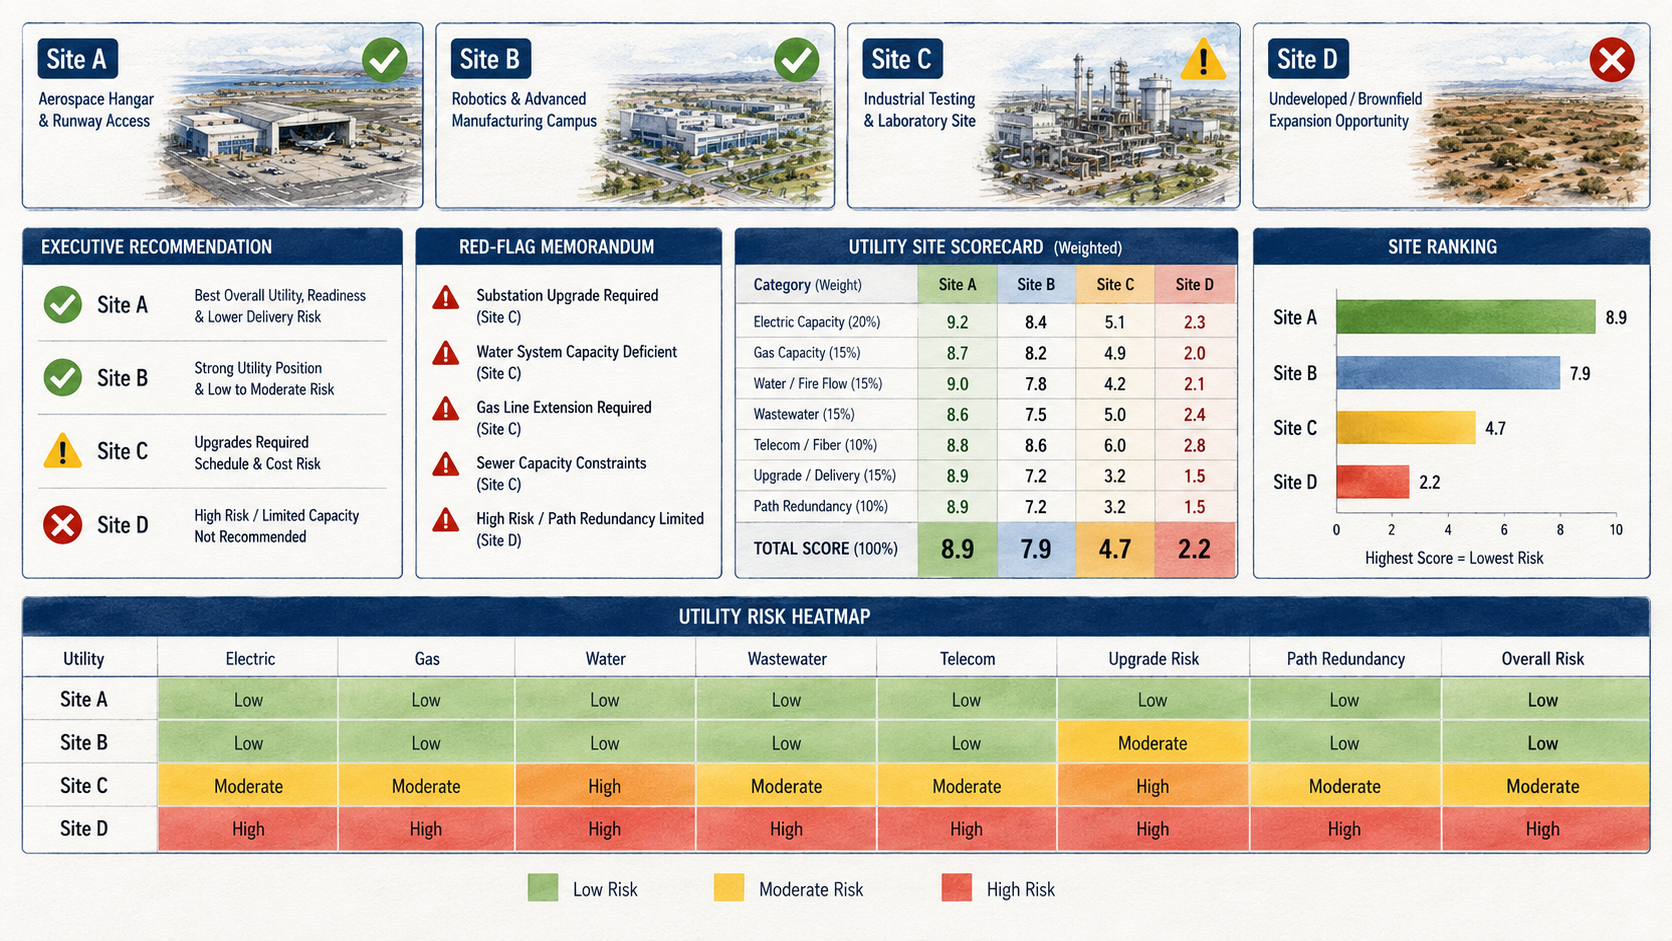
03 · Scorecard

Weighted Utility Site Scorecard

Every candidate scored and weighted across seven utility categories — paired with an executive recommendation, a red-flag memorandum, and a full risk heatmap.

Scorecard Red-flag memo Risk heatmap
Utility site scorecard, executive recommendation, red-flag memorandum, site ranking and utility risk heatmap
04 · Dashboard

Live Site Comparison Dashboard

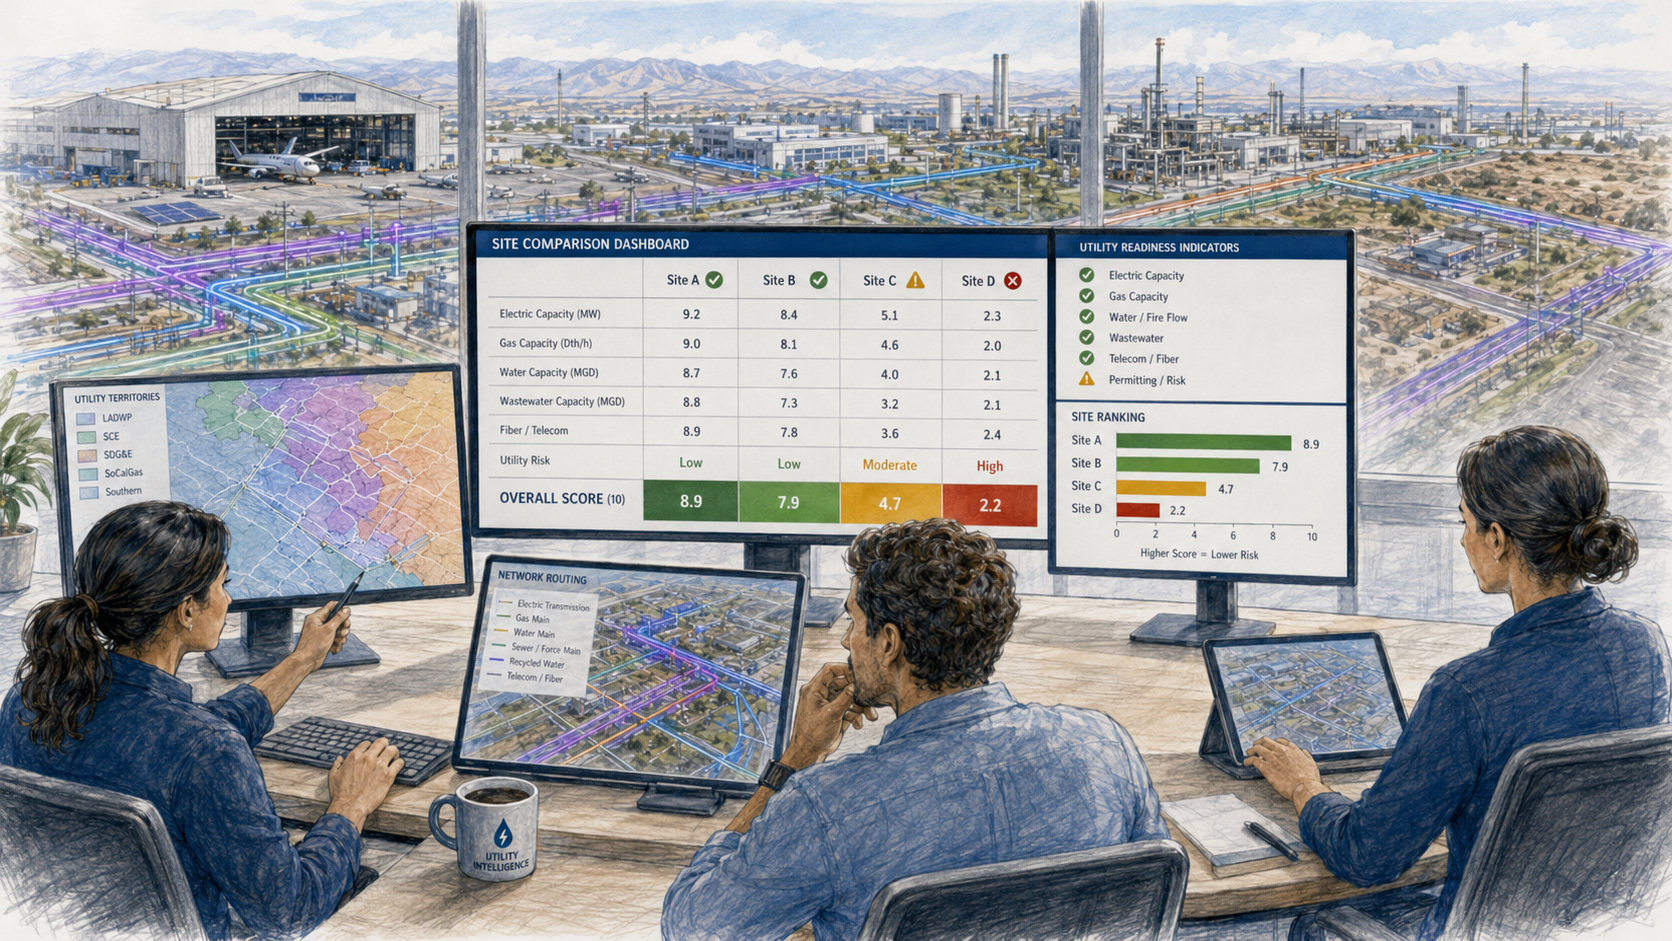
Capacity, readiness indicators, network routing, and an overall score for each site — in one dashboard your team and capital partners can act on together.

Capacity Readiness Routing Score
Site comparison dashboard with capacity metrics, utility readiness indicators, network routing and site ranking

Comparing sites right now?

Send us your candidates. We'll return a utility scorecard, a red-flag memo, and a clear recommendation before you sign.

Request a site screening →

Joint Trench Coordination · Utility Coordination Hub

One trench. One schedule. One platform.

A single trench can involve electric, gas, telecom, fiber, street lighting, civil improvements, permits, inspections, and a dozen stakeholders. We don't just track that work — we organize it, coordinate it, document it, and drive it from early planning through energization and closeout.

Coordinate your trench 12 platform modules below ↓

The Problem

Eight stakeholders. Eight schedules. One trench.

The owner has one schedule. The GC has another. Utility companies have separate requirements, the designer is waiting on comments, the civil engineer is managing conflicts, the subcontractor is waiting for direction — and telecom is missing from the conversation until it's late. By the time issues appear in the field, they are expensive to fix.

delayed designs missing applications conflicting routes unclear ownership permit gaps redesigns change orders inspection failures late energization

The Solution

Utility Coordination Hub — a digital command center for the trench.

Instead of scattered emails, spreadsheets, PDFs, and disconnected meetings, every owner, builder, utility, designer, agency, and field crew works from one live project environment — one shared source of truth for every task, document, milestone, approval, conflict, and field update.

12 modules · every stakeholder · one source of truth

What Decision Construction coordinates

Design → approvals → field → release
Electric service Gas service Telecom · fiber · cable Joint trench routing Application tracking Provider follow-up Dry utility design Civil conflict review Meter locations Transformers · vaults · pull boxes Easements & right-of-way Permits & agencies Schedule sequencing Subcontractor coordination Field installation tracking Inspections & punch lists Energization & closeout

Inside the platform

Twelve modules. Every stakeholder covered.

MODULE 01

Project Dashboard

A live view of where the entire utility process stands — trench phase, provider status, pending applications, open comments, permits, overdue tasks, and energization readiness in one glance.

▸ Critical-path items surfaced automatically ▸ Provider-by-provider progress ▸ Field installation & inspection status ▸ Energization readiness score
MODULE 02

Stakeholder Portal

Every stakeholder gets access based on their role — owners see progress and risk, GCs see schedule impacts, utilities see submittals, engineers see conflicts, subs see scope and dates, agencies see permits. Aligned, without forcing everyone into the same workflow.

▸ Role-based module visibility ▸ Executive & lender read-only views ▸ No technical noise for non-technical roles
MODULE 03

Joint Trench Map

A visual coordination map of routes, corridors, alignments, vaults, meters, easements, and constraints — so the team sees utility conflicts early, instead of discovering them during excavation.

▸ Electric, gas, telecom & fiber alignments ▸ Vaults, pull boxes, transformers, service points ▸ Conflict pins linked to issue tracking ▸ Field notes & photo locations
MODULE 04

Utility Matrix

A responsibility matrix for every provider — applications, design packages, fees, contacts, review timelines, inspections, and release requirements. No more confusion about who owns each step before the trench can move.

▸ Every provider, every requirement ▸ Cross-utility dependencies flagged ▸ Assigned contacts & review clocks
MODULE 05

Task & Milestone Tracking

Joint trench work depends on sequencing. The platform breaks the process into clear milestones — from research and applications through pull wire, meter set, and energization — with an owner, due date, status, and priority for every task.

▸ 19 standard milestones, phase by phase ▸ Ownership on every task ▸ Overdue items escalated automatically
MODULE 06

Document Control

Applications, plans, trench details, easements, permits, comments, photos, and as-builts — organized by category and version. Nobody works off an outdated plan, because the latest approved file is unmistakable.

▸ Version history with superseded locks ▸ Latest-approved always flagged ▸ Field photos tied to stations
MODULE 07

RFI, Conflict & Issue Management

Route conflicts, separation violations, grading clashes, meter and vault placement issues, permit delays, field obstructions — each one assigned to the responsible party and tracked until it's resolved, not until it's forgotten.

▸ Severity, ownership & due dates ▸ Linked to map pins and plan sheets ▸ Full comment trail for accountability
MODULE 08

Schedule Integration

Utility milestones connect to the main construction schedule — so the team sees exactly how a utility delay ripples into grading, paving, inspections, occupancy, and energization. Utility work becomes part of the sequence, not an afterthought.

▸ Critical-path utility tasks & dependencies ▸ Activities blocking field work flagged ▸ Provider release & energization windows
MODULE 09

Field Coordination Tools

Crews update the platform from the trench — daily progress, photos, utility markings, installed conduit, material deliveries, conflicts, and punch items. A real-time connection between the office, the design team, the providers, and the field.

▸ Photo & progress upload by station ▸ Conflicts flagged from the jobsite ▸ Office ↔ field, real time
MODULE 10

Notifications & Automated Reminders

The platform does the follow-up: overdue tasks, new comments, design revisions, permit updates, inspections, schedule changes, and approval deadlines trigger the right people automatically — no more chasing by email.

▸ Rule-based triggers per stakeholder ▸ Email, SMS & in-app delivery ▸ Nothing important slips through
MODULE 11

Reporting for Owners & Executives

Decision-grade summaries for owners, developers, lenders, and leadership — overall status, open risks, schedule impacts, budget exposure, and the decisions needed — without requiring anyone to manage technical utility detail.

▸ One-page executive format ▸ Auto-generated & scheduled delivery ▸ PDF, XLSX, or live link
MODULE 12

Closeout & Energization Readiness

Inspection sign-offs, as-builts, approvals, meter release, punch completion, provider confirmations — organized so the project never reaches the finish line only to discover something is missing.

▸ Readiness score per parcel ▸ Every release requirement tracked ▸ Complete closeout documentation

Benefits

Every stakeholder gets what they need.

Owners & Developers

Visibility, accountability, and schedule control — what's complete, what's delayed, what decisions are needed.

General Contractors

A utility sequence aligned with the construction schedule — trench, inspections, paving, and site access coordinated.

Utility Companies

Organized submittals, current documents, and one coordination point — less confusion, less repeated follow-up.

Engineers & Designers

Conflicts identified earlier, revisions managed efficiently, comments connected to the latest plans.

Subcontractors

Clear scope, current plans, real dates, and live field updates — less rework, less downtime.

Agencies & Municipalities

Organized permit documentation, coordinated inspections, and clearer communication in the right-of-way.

Lenders & Investors

Better visibility into infrastructure risk, schedule exposure, and utility readiness — before issues become costly delays.

Why this matters

One delay ripples through everything.

Utility approval → Trenching → Paving → Inspections → Energization → Occupancy & revenue

Joint trench coordination is not just a technical process — it is project risk management. Decision Construction prevents those delays by managing the utility process early, actively, and transparently.

One trench. One workflow. Every stakeholder aligned.

Hands-on utility consulting plus purpose-built coordination software — a cleaner process, fewer delays, less rework, and a predictable path to installation, inspection, energization, and closeout.

For Agencies · Utility & Permitting Coordination

One clear counterpart for every agency.

Defense, aerospace, robotics, and data center campuses touch a lot of desks — utilities, fire, air, water, building, and public works. We give every reviewer complete submittals, one point of contact, and a clear picture of who owns what, so your process moves without the back-and-forth.

Who we bring to the table

Every reviewer, aligned on one project.

ELECTRICLADWP · SCE · SDG&E · municipal
GASSoCalGas · local providers
WATERWater districts · MWD · fire flow
SEWERSanitation · industrial-waste
STORMWATERPublic works · regional board
FIRELocal fire authority · LAFD
AIRSouth Coast AQMD · county APCD
BUILDINGBuilding & safety · plan check
PUBLIC WORKSRight-of-way · transportation
TELECOMCarriers · fiber · secure comms

What we do for your review

We make the file easy to say yes to.

Complete submittals

Loads, plans, and data packaged the way your team needs them — fewer rounds of corrections.

One point of contact

A single accountable coordinator across the owner, builder, and every other agency.

Tracked comments

Every condition logged, answered, and closed — nothing lost between departments.

Sequenced inspections

Work is ready before the inspector arrives, so trips aren't wasted and dates hold.

The path we manage

From application to power — in order.

Reviewing a hard-tech project?

We'll be your single, prepared counterpart — complete packages, tracked conditions, and inspections that are ready on the day.

Start coordinating →

For Government Agencies · Rebuild Intelligence Hub

Every department sees a piece. You need the whole picture.

A single rebuild parcel touches Building & Safety, Planning, Engineering, Public Works, Transportation, DWP, Fire, County departments, utilities, and elected offices — each with its own records. We fuse those layers into one shared operating system for recovery: where every rebuild stands, what's blocking it, and what must happen next.

The Government Challenge

Rebuild activity does not move through one department.

When hundreds or thousands of properties rebuild at once, every agency needs the same answer to the same question: where does each rebuild stand, what is blocking progress, and what public infrastructure work is required next? Fragmented records make that answer impossible — until issues surface as complaints, missed inspections, and stalled corridors.

no single live view of parcels permit status ≠ utility status limited wet + dry visibility duplicate resident outreach complaints beat the data inconsistent documentation ROW & trenching uncoordinated hard to report to leadership, FEMA & the public

One source of truth for the operational side of rebuilding

Parcel · block · corridor · jurisdiction
Permit progress Parcel-by-parcel status Active builders & primes SFR · MF · commercial · mixed-use Wet utility issues Dry utility issues Right-of-way impacts Street excavation & trenching Traffic control Infrastructure dependencies Agency approvals & reviews Inspection readiness Block clearance Notices & outreach Access issues Field conflicts Builder bottlenecks Public progress reporting Compliance & audit documentation

The Platform · Rebuild Intelligence Hub

Leadership visibility without manually assembled reports.

A secure, map-based coordination and reporting platform — configurable for city agencies, county departments, utility providers, council offices, and approved external stakeholders.

MULTI-AGENCY COORDINATION MATRIX

Which department is involved, what action is required, who owns the next step, what's missing, and what deadline applies — cross-department dependencies made visible instead of buried in isolated records.

PUBLIC-FACING PROGRESS REPORTING

Resident-friendly dashboards: progress by neighborhood, permits issued, upcoming street work, meeting dates — transparent for the public, while sensitive internal notes remain private.

R-02GIS Parcel & Corridor MapRebuild activity by parcel, block, corridor, or jurisdiction — pressure visible before delays.
R-04Utility Readiness TrackerWhether a rebuild is truly ready to proceed — not just whether a permit advanced.
R-05ROW & Public Works TrackerExcavation, restoration, lighting, signals, closures, work windows, inspections.
R-06Outreach & Notice LogDefensible proof of notification — searchable, photographed, audit-ready.
R-07Builder & Contractor ActivityWho's active where, repeated bottlenecks, projects at risk — support or enforce early.
R-08Field Issue & Escalation MgmtOwner, agency, priority, photos, location, resolution history — visible until closed.
R-10Compliance & Funding ReportingFEMA-style, state recovery, district reporting, grant & reimbursement documentation.
R-11 · DATA WAREHOUSE & APIConnects the data between agency systems
Permit systems GIS 311 Public works Inspections EM reporting

Consulting Support

Software plus the field team that keeps the data true.

Our consultants organize the field reality behind the permit data — so the dashboard reflects the street, not last month's spreadsheet.

✓ Rebuild process mapping ✓ Interagency workflow coordination ✓ Wet + dry utility coordination ✓ Public right-of-way coordination ✓ Parcel-by-parcel status verification ✓ Field data collection & GIS support ✓ Community outreach strategy ✓ Agency meeting & executive reporting ✓ Dashboard configuration ✓ Compliance documentation

Value by Stakeholder

One system, eight constituencies served.

City AgenciesRebuild volume, utility conflicts, ROW impacts, workloads, inspection bottlenecks.
County DepartmentsUnincorporated areas, county roads, cross-jurisdictional recovery in one view.
Council & Supervisor OfficesReliable status, issue tracking, and clear answers for constituents.
Emergency ManagementSituational awareness for recovery ops, sequencing, and escalation.
Public WorksStreet cuts, trenching, restoration, sewer, storm, lighting, traffic, ROW.
Utility ProvidersClearer coordination with builders, agencies, contractors, and public works.
State & Federal PartnersCleaner data, stronger documentation, visibility into pace and barriers.
Residents & BusinessesBetter communication, clearer timelines, fewer surprises, an organized rebuild.

Track every parcel. Coordinate every agency. Clear every utility path.

Rebuilding at scale is an interagency coordination challenge. For city agencies, county departments, utility providers, public works teams, emergency management leaders, and elected offices — one shared operating system for rebuild visibility.

For Investors · Site Power & Infrastructure Checks

Know the site can be powered before you buy.

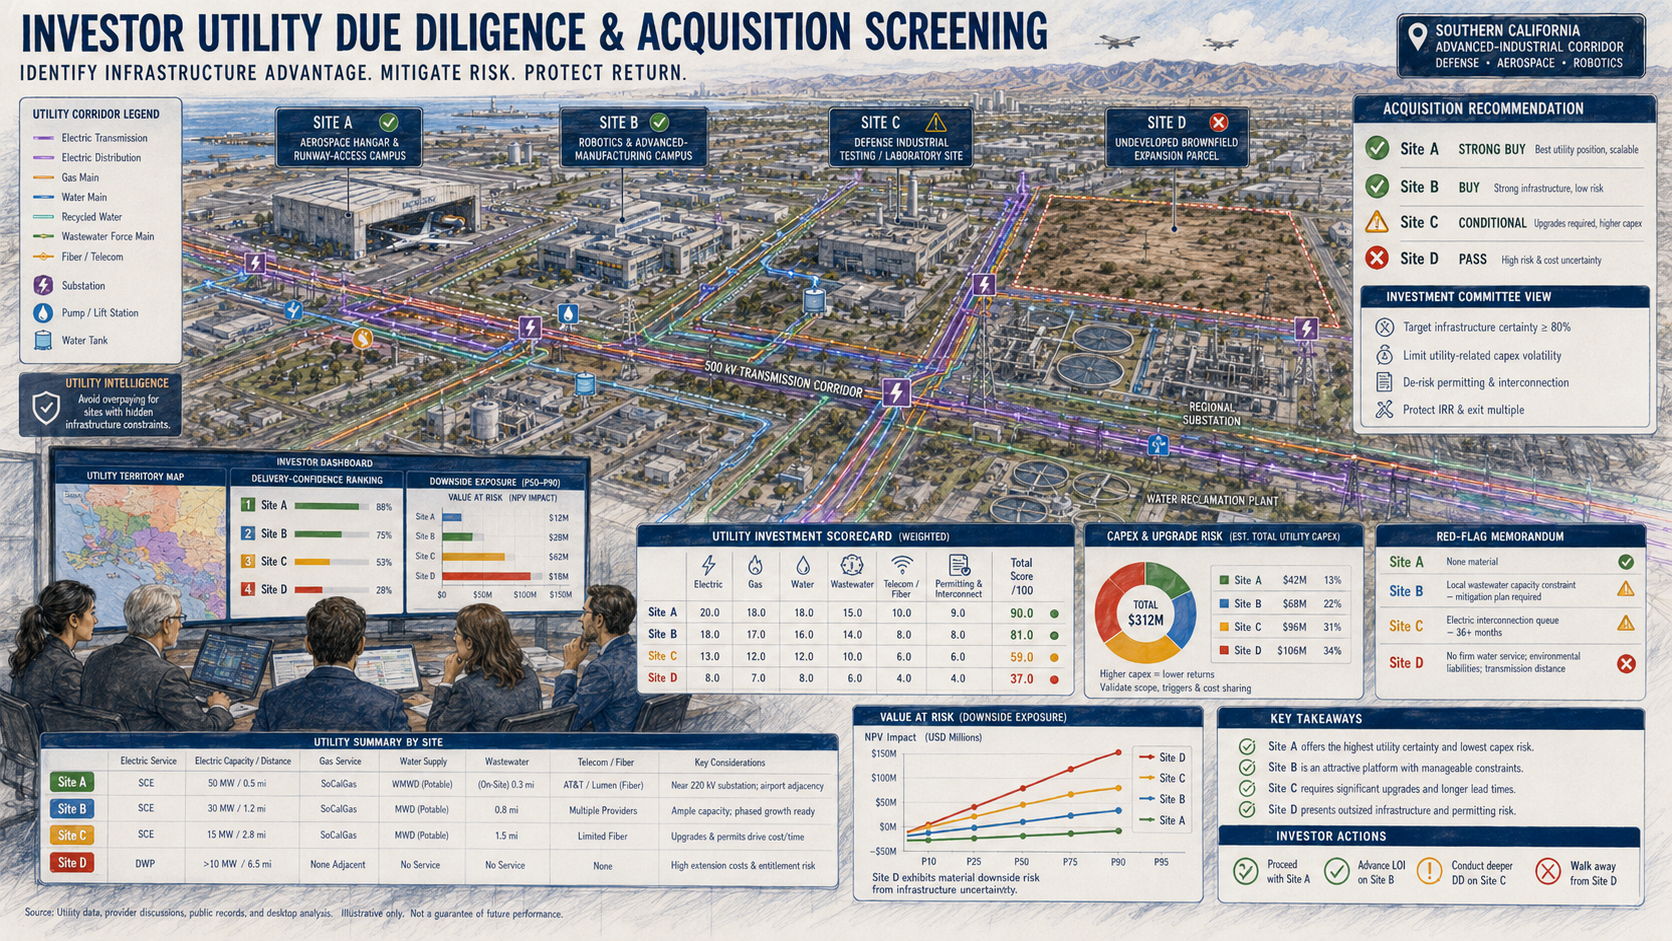
A great building doesn't mean the power, water, and gas are actually there. A strong tenant doesn't mean the site can be up and running on time. We check all of it for you, explain it in plain terms, and show you the proof — before you commit money.

Commission a diligence Independent · evidence-graded
24independent checks we run
A–Ehow sure we are the power is real
13things we weigh in a score
0–13steps from first look to sale

Three things in one deal

Three investments, not one.

Every hard-tech deal is a real-estate asset, a utility platform, and an operating company stacked together. Each layer needs its own evidence — conflating them is where capital gets surprised.

Real Estate Assetvaluation · zoning · rent
+
Utility & Infrastructure Platformcapacity · time-to-power · capital
+
Operating Company / Tenant Creditramp · funding · dependency

How sure are we the power is real?

Not all “powered” is equal.

ADelivered / contractualEnergized service, approved design, executed agreement, released capacity.
BProject-specific engineeringAccepted application, utility study, project will-serve, cost & scope.
CProject-related planningWritten correspondence, preliminary assessment, documented discussion.
DPublic / observationalCapacity portal, nearby substation or circuit, historical demand.
EUnsupported assertionBroker, seller, landlord, or brochure statement — no evidence attached.

What we weigh most

What matters most when we score a site.

Tenant / operator quality14%
Utility capacity evidence12%
Time to power & operation10%
Total utility capital confidence9%
Development & construction feasibility8%
Production-plan credibility8%
Alternative-use value8%
Expansion optionality6%
Resilience & continuity6%
Exit transferability5%

+ lease clarity 5% · entitlement risk 5% · operating utility cost 4% · each factor scaled by evidence confidence

What usually goes wrong

The problems we catch early.

The power isn't really there

The listing says “powered site,” but no capacity was ever reserved for this project.

Getting power takes years

The utility line and construction can run 18–36 months — long after the building is finished.

A big hidden bill

Transformers, on-site wiring, off-site work, and deposits that aren't in the building budget.

Finished but can't turn on

The building is done, but the meter, fire water, or final inspection isn't — so nothing runs.

The tenant can't fund it

The operating company's plan leaves out the utility money it actually needs to open.

Hard to sell later

Custom, tenant-specific systems the next buyer can't use — so the value walks out the door.

Investor utility due diligence and acquisition screening dashboard comparing four Southern California candidate sites

What we check

Everything we check, first look to sale.

INV-01Market intelligence
INV-02Asset screening
INV-03Acquisition diligence
INV-04Powered-land verification
INV-05Tenant facility diligence
INV-06Demand forecasting
INV-07Time-to-power
INV-08Development feasibility
INV-09Cost-to-complete
INV-10Lease & transaction
INV-11Entitlement risk
INV-12Resilience & insurability
INV-13Energy-cost underwriting
INV-14Incentive intelligence
INV-15Lender advisory
INV-16Committee decision support
INV-17Delivery monitoring
INV-18Draw & change review
INV-19Revenue-readiness
INV-20Asset value enhancement
INV-21Portfolio intelligence
INV-22Distressed & special situations
INV-23Exit & refinancing
INV-24Managed intelligence

How a deal moves

Proof at every step — from first look to sale.

G0 Thesis G1 Pipeline G2 Exclusivity G3 Diligence budget G4 Approve G5 Close G6 Design G7 Long-lead G8 Construction G9 Utility construction G10 Completion draw G11 Operational G12 Stabilize G13 Exit

The questions we answer

Plain answers, backed by proof.

Is the power actually there — and reserved for this deal?

How long until the site can really turn on?

What's the true, all-in utility bill to get it running?

Who pays for what — landlord, tenant, or you?

Can the tenant afford the utility work their plan needs?

If the deal goes sideways, can someone else use the site?

Is there room to grow later?

When it's time to sell, is everything documented and transferable?

Underwriting a hard-tech deal?

Bring us in before exclusivity or before the committee. We deliver capacity evidence, time-to-power, total utility capital, and exit transferability — graded and independent.

Commission a diligence →

For Prime Contractors & Civil Firms · Decision Infrastructure Hub

You build behind the line. We clear ahead of it.

On major rebuilds, the biggest delays happen before the crew ever starts work — a block not cleared, a resident not notified, a cut-over window missed. We run the coordination front: community readiness, utility synchronization, right-of-way documentation, and agency communication, block by block, ahead of your production.

The Challenge

The work around the work is what stops crews.

Your teams execute heavy civil, trenching, roadway, and infrastructure work. But on multi-block programs you also inherit residents, businesses, agencies, utilities, traffic requirements, and political visibility. Even the best civil team loses momentum when that coordination breaks down — and those losses hit production, sequencing, manpower, and claims exposure directly.

residents not notified driveway & parking conflicts missed cut-over windows PMs mediating complaints council-office escalations incomplete ROW documentation agencies on different data late wet/dry conflicts compliance scattered in email crews mobilized before the block is ready

What We Manage

Five fronts, run ahead of your production.

01

Community Logistics

Resident & business notifications, door-to-door and multilingual outreach, block captains, driveway/parking/trash coordination, hotline, complaint intake & resolution.

02

ROW & Block Readiness

Sign-offs, parcel access, block-by-block clearance, traffic control readiness, staging areas, work windows, and agency restrictions — one answer: is this block ready?

03

Utility Synchronization

Provider schedules, power transitions, gas, telecom, joint trench sequencing, wet/dry conflicts, cut-over windows, and inspection milestones — no utility stand-downs.

04

Agency Coordination

Transportation, public works, engineering bureaus, council offices, funding programs — the communication trail organized, approvals tracked, issues escalated early.

05

Compliance Documentation

Notices delivered, residents contacted, ROW resolved, utility steps completed, photos and proof — an audit-ready record, not a scattered email trail.

The Platform · Decision Infrastructure Hub

Which blocks are cleared? Which crews can move?

A live command center for every block, parcel, stakeholder, utility, agency, field issue, and clearance milestone — answering the questions that must be answered before crews mobilize.

GIS PARCEL TRACKING

Cleared parcels, pending notifications, access issues, ROW limits, staging, utility corridors, field issues, and photo locations — community logistics as a visual management system.

72-HOUR NOTICE TRACKING

Type, delivery date, method, proof photo, response, and clearance per parcel — with a hard block gate: crews don't mobilize until required outreach is verifiably complete.

H-03Stakeholder Communication LogEvery resident, business, agency, and provider interaction — searchable and audit-clean.
H-05Cut-Over & Joint Trench CoordinationOne shared utility schedule — shutdowns, transitions, inspections, releases, restoration.
H-06Wet + Dry Data WarehouseMains, storm, water, electric, gas, fiber, trench profiles, ownership, depth, easements.
H-08Field Updates & Photo DocumentationWork zones, deliveries, obstructions, confirmations — office and field on one record.
H-09Issue & Escalation TrackingOwner, due date, priority, attachments, resolution history — visible until closed.
H-10Owner, Agency & Executive ReportingCorridor readiness, outreach, cut-overs, schedule risk — progress you can defend.
H-07 · ENTERPRISE INTEGRATIONFlows into the systems you already run
Procore Autodesk Civil 3D ESRI ArcGIS BIM / VDC ERP REST API
Crews make money moving.

Production, sequencing, manpower, and subcontractor plans all assume the block is ready.

One uncleared block

Idle crews, re-sequencing, standby costs, claims, change orders, and owner pressure — all from coordination that should have happened weeks earlier.

An audit-ready record

Notices, contacts, resolutions, photos, approvals — documentation that defends your schedule and your decisions.

The Prime Contractor Benefit

A partner between the field, the public, the agencies, the utilities, and the data.

✓ One partner for community logistics + utilities ✓ One platform for block, parcel & ROW tracking ✓ Real-time corridor readiness ✓ Fewer missed notifications & access issues ✓ Stronger provider coordination ✓ Outreach, traffic control & field work aligned ✓ Compliance documentation built in ✓ Reduced PM burden ✓ Lower risk of costly crew downtime ✓ A cleaner path from mobilization to closeout

We clear the path so you can build without friction.

No production time lost because a block wasn't cleared, a resident wasn't notified, a provider missed a window, or a right-of-way issue was buried in an email thread.

For Builders · Utility Delivery Strategy

You build it. We make sure it can be energized.

A facility can be physically complete and still unable to operate — waiting on permanent power, transformers, fire flow, or an inspection. We manage the owner-side and builder-side utility path as one program, from pursuit through energization and turnover.

Protect your energization date 4 workstreams below ↓
Workstream 01 / 04 01 · Master Planning

Industrial Utility Master Planning

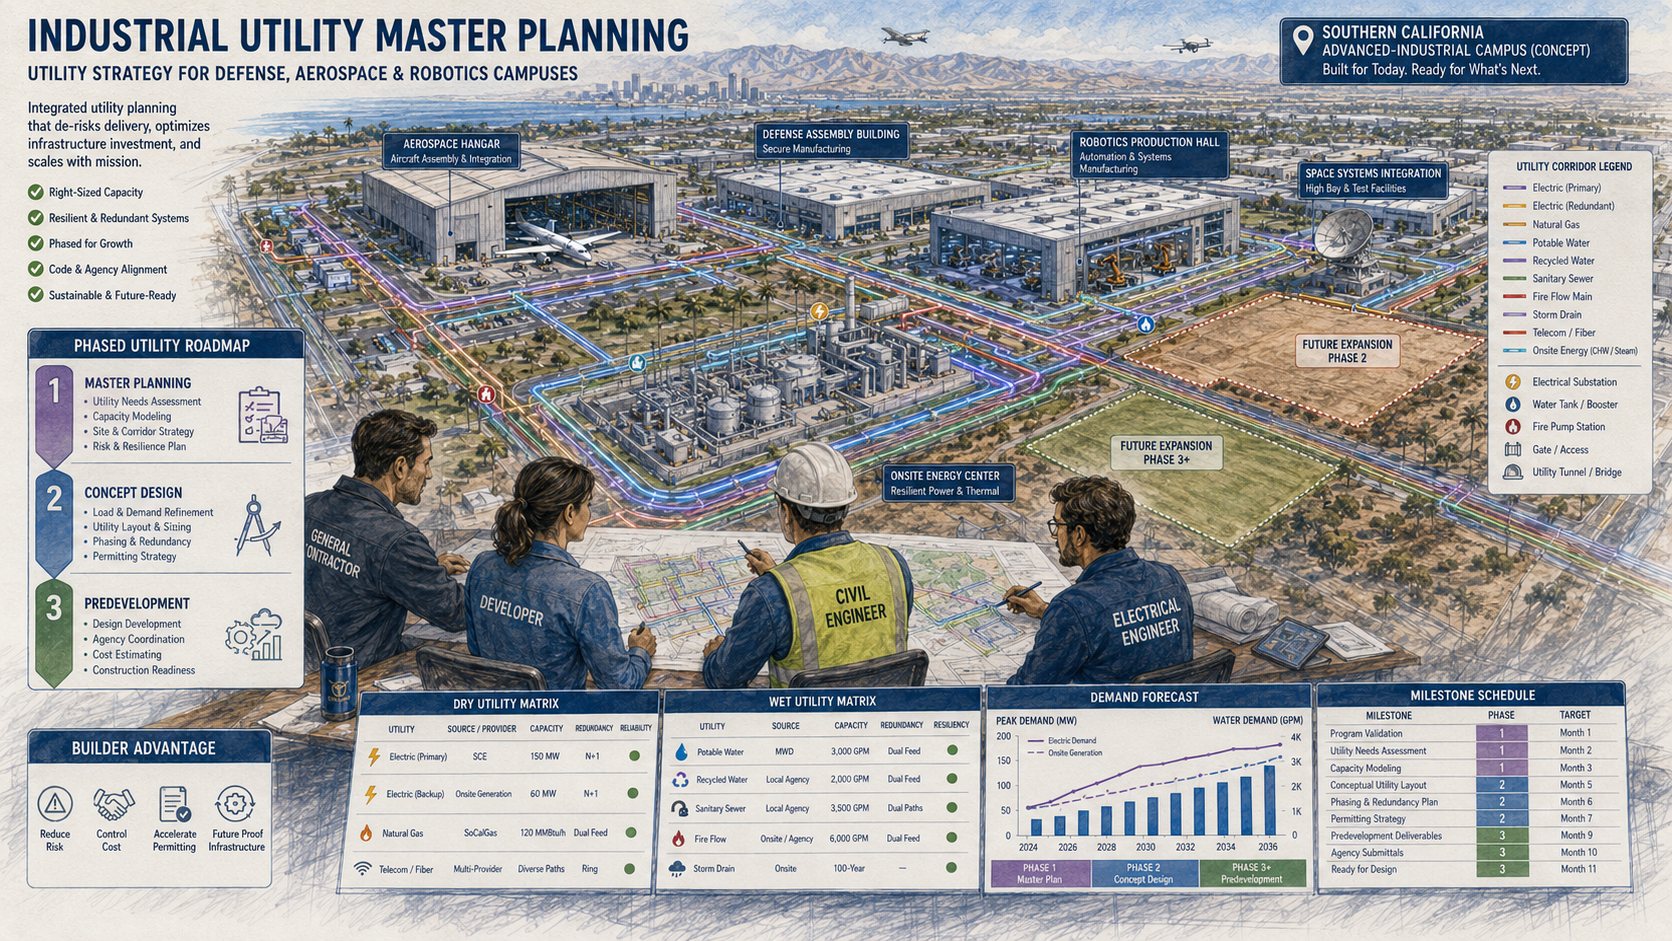
Right-sized capacity, phasing, redundancy, and corridor strategy across the whole campus — a phased utility roadmap from master plan through predevelopment, with dry and wet utility matrices.

Capacity Phasing Redundancy Corridors
Industrial utility master planning: phased roadmap, dry and wet utility matrices, demand forecast and milestone schedule for a defense, aerospace and robotics campus
Workstream 02 / 04 02 · Dry Utility

Dry Utility Corridor & Joint Trench

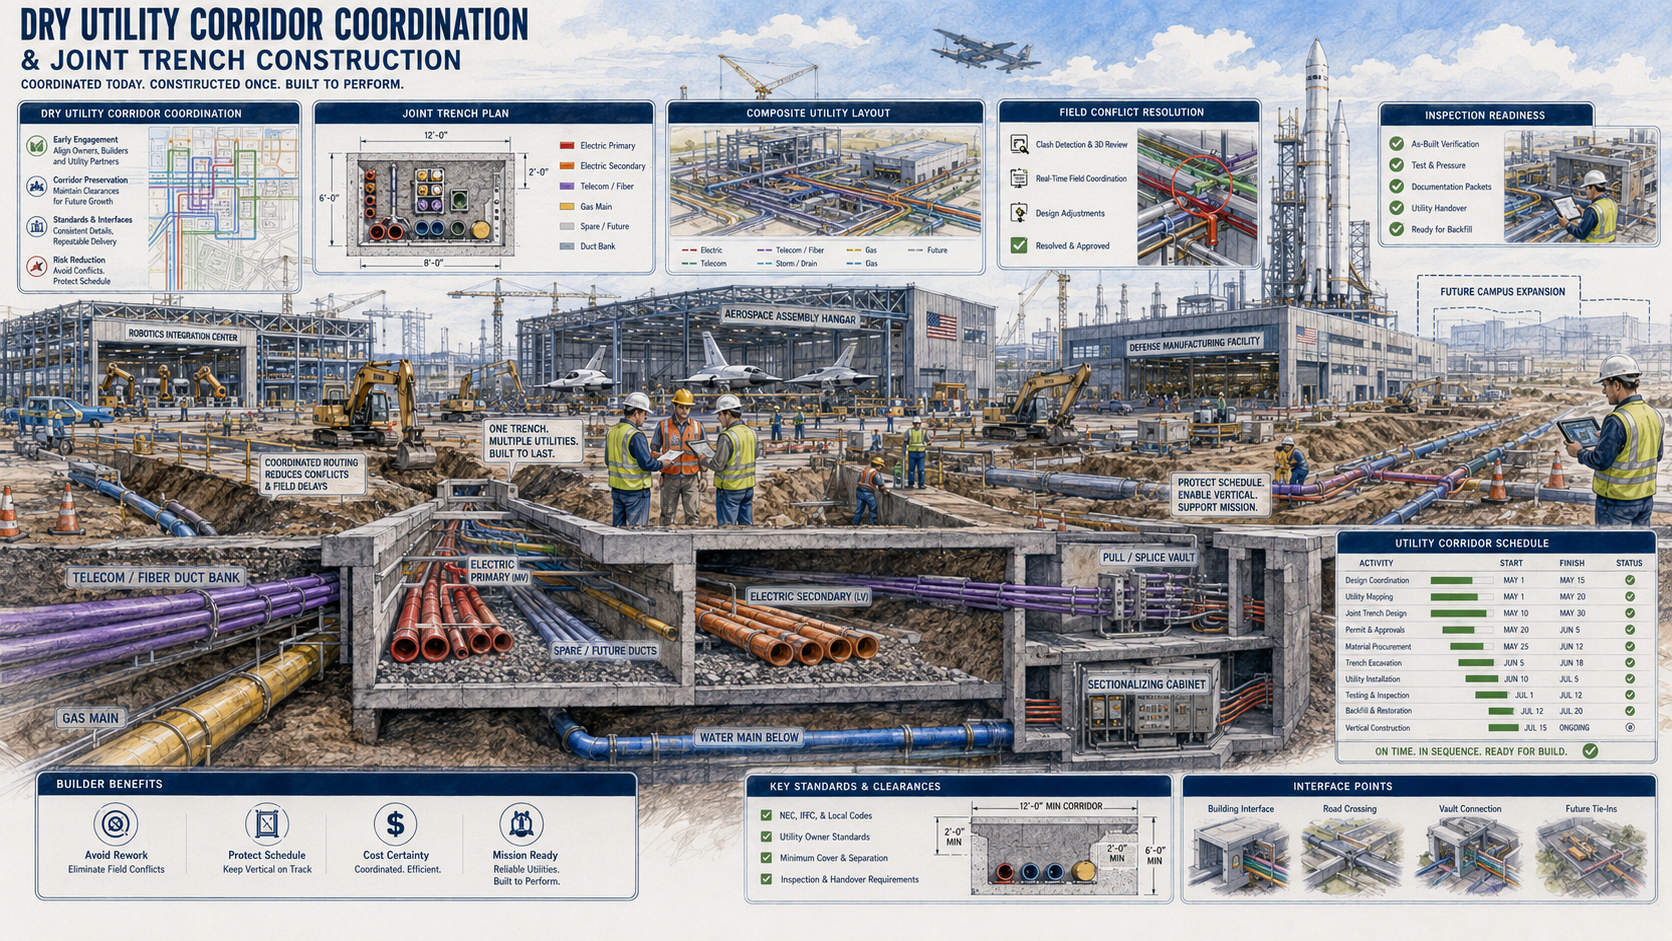
Electric, gas, telecom, fiber, and spare pathways coordinated into one composite corridor and joint trench — conflicts resolved in 3D before backfill, with an inspection-ready handover.

Composite plan Joint trench Conflict resolution Inspection
Dry utility corridor coordination and joint trench construction: composite utility layout, duct bank section, corridor schedule and inspection readiness
Workstream 03 / 04 03 · Power

Power Capacity & Energization Readiness

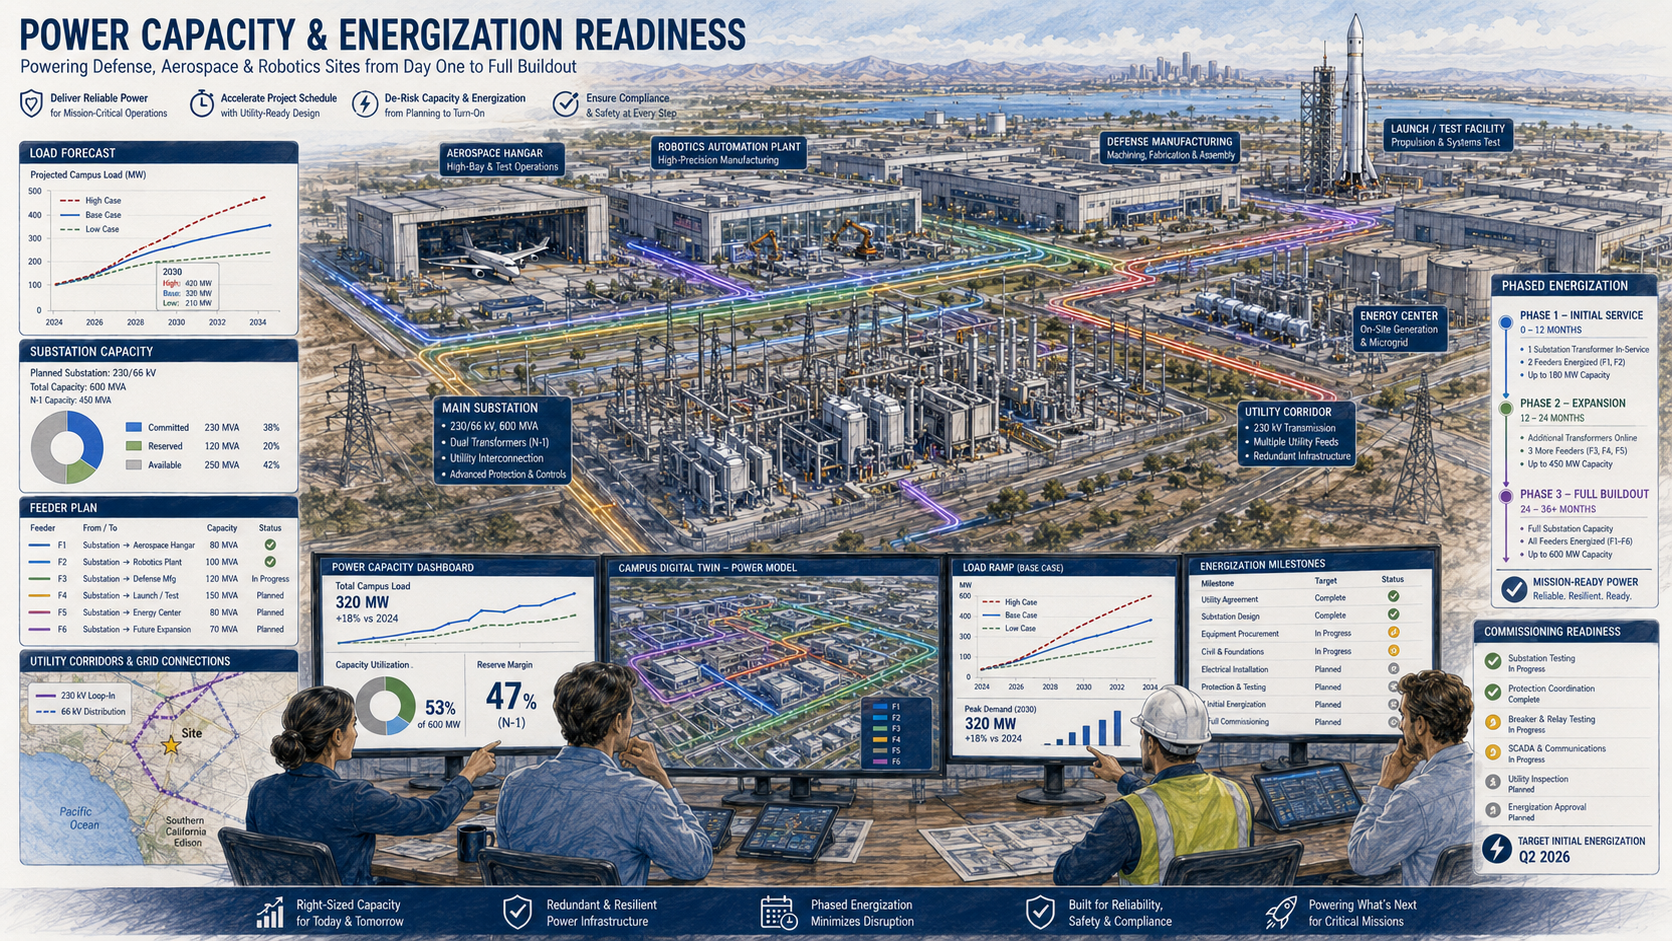
Substation capacity, feeder plan, and phased energization from initial service to full buildout — tracked on a live readiness dashboard so power arrives when the schedule needs it.

Substation Feeders Phased energization Readiness
Power capacity and energization readiness: load forecast, substation capacity, feeder plan, phased energization and commissioning readiness
Workstream 04 / 04 04 · Delivery

Builder Utility Delivery Strategy

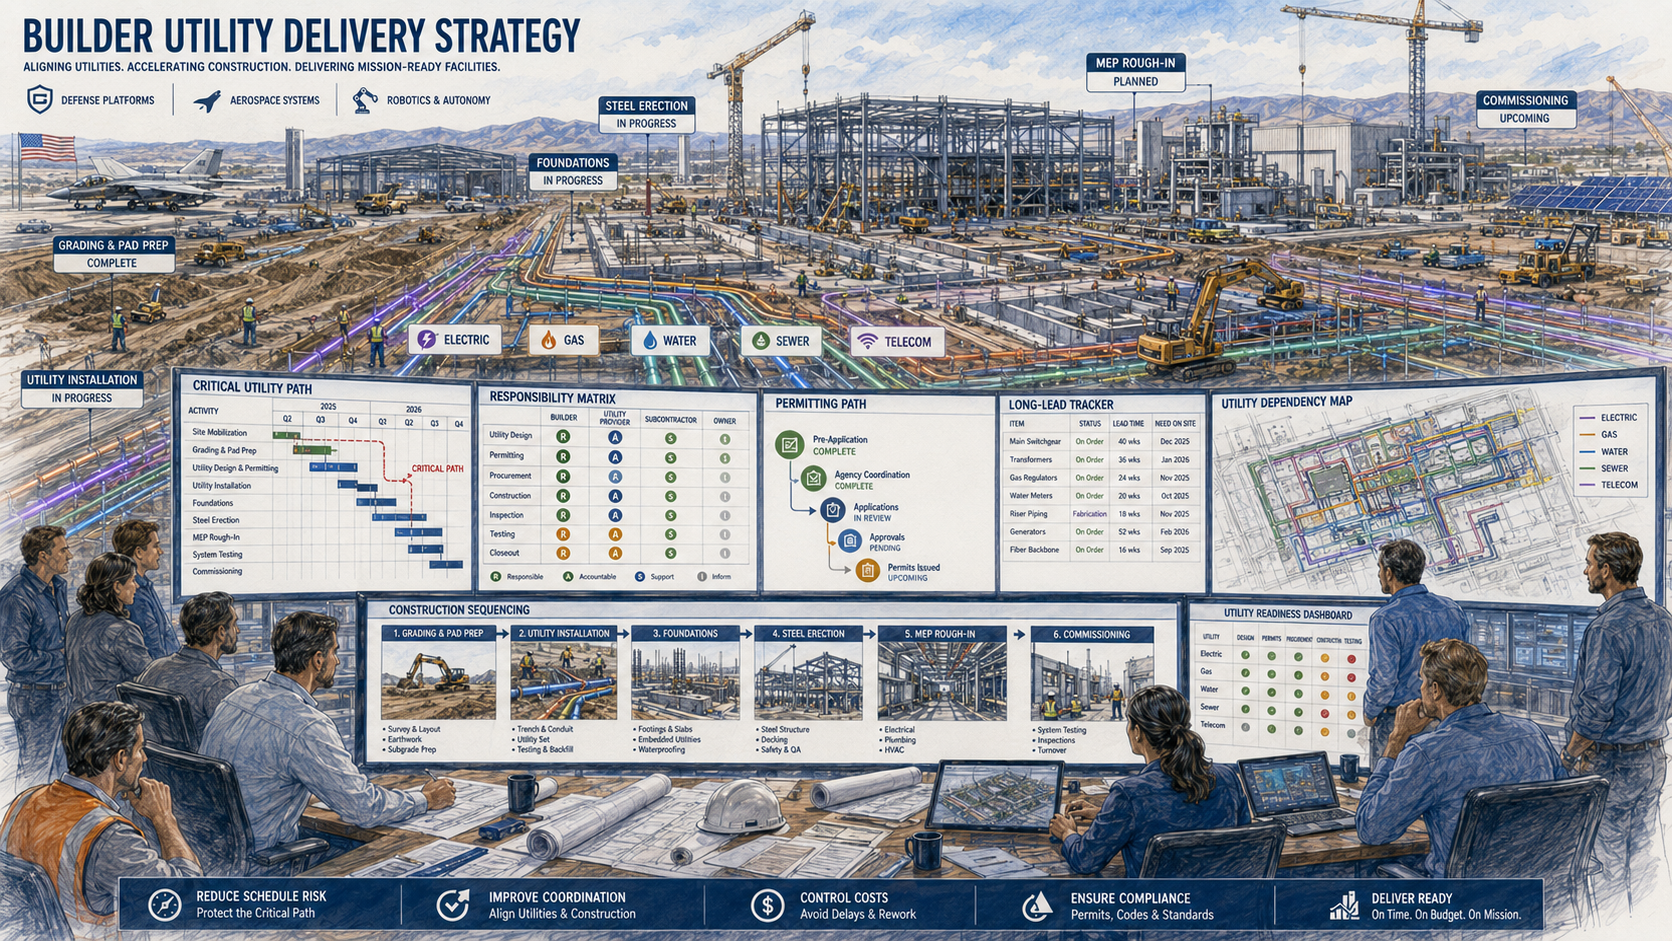
Critical utility path, responsibility matrix, permitting path, long-lead tracker, and construction sequencing — utilities aligned to the build so nothing waits on an unowned scope.

Critical path RACI Long-lead Sequencing
Builder utility delivery strategy: critical utility path, responsibility matrix, permitting path, long-lead tracker, construction sequencing and readiness dashboard

The gap we close

Complete is not the same as operational.

Your building date is one path. The operational date depends on utilities, agencies, long-lead equipment, easements, and inspections outside your direct control. We manage that whole chain as one critical path — so the facility can actually run on the day you hand it over.

Owner Requirements → Load Forecast → Utility Strategy → Applications → Permits → Procurement → Construction → Inspection → Energization → Production

Who we work with

One platform, every builder role.

General Contractors

Scope clarity, a real energization schedule, and fewer utility change orders.

Design-Builders

Utility criteria built into design; load forecasts aligned to applications.

CM / Owner's Rep

Utility governance, a unified dashboard, and executive readiness reporting.

Industrial Developers

Site screening, utility-ready product, and tenant-attracting infrastructure.

Owner-Builders

Production plans translated into phased, financeable capacity delivery.

EPC / Mission-Critical

MV, substation, generation, storage, and microgrid integration.

Electrical & Civil

Approved standards, inspection sequencing, and clean cutover coordination.

Landlord / TI

Base-building capacity, shared infrastructure, and utility-ready suites.

Delivered gate by gate

A stage-gate from pursuit to turnover.

G0 Pursue G1 Requirements G2 Site G3 Concept G4 Applications G5 Design G6 Long-Lead G7 Utility Civil G8 Utility Construction G9 Inspection G10 Energization G11 Testing G12 Turnover

Engagement packages

Come in at any stage.

PACKAGE A

Pursuit Advisory

RFP pursuits, design-build competitions, GMP prep.

PACKAGE B

Preconstruction

Early design, build-to-suit, existing-facility expansion.

PACKAGE C

Full Delivery

Complex campuses, new sites, major service upgrades.

PACKAGE D

Dry Utility & CM

Greenfield, campus infrastructure, joint trench, relocations.

PACKAGE E

Recovery

Delayed projects, missed milestones, failed inspections.

PACKAGE F

Operating-Site Upgrade

Active defense, aerospace, and robotics facilities.

PACKAGE G

Multi-Site Program

National builders, repeat clients, portfolio developers.

NOT SURE?

Tell us where the project stands — we'll scope the right package.

Building a hard-tech facility?

Bring us in at pursuit or preconstruction. We'll map the utility critical path, own the coordination, and keep your energization date protected.

Talk to a delivery strategist →

For Builders · SFR · Multifamily · Commercial

From scattered parcels to a streamlined pipeline.

Rebuilds move fast, but utilities move slowly — and across ten, twenty, or fifty parcels, every utility issue multiplies. We combine hands-on consulting with a multi-parcel coordination platform so you can see every parcel, every utility, every blocker, and every next step in one place.

Audit your portfolio Watch the mess resolve →

The Challenge

On one project it's complex. Across a portfolio, it's a coordination burden.

Each parcel has different utility conditions, agencies, service requirements, meter locations, trench routes, easements, and approval timelines. Most builders are forced to track it all through email chains, spreadsheets, plan sets, and phone calls — and the risk multiplies with every active site.

unclear existing conditions delayed applications missing service requirements conflicting routes uncoordinated wet + dry scopes slow provider responses permit & agency delays field conflicts found late unclear responsibility delayed meter sets no portfolio-wide dashboard

The Solution

One command center for every parcel in your pipeline.

Which parcels are ready? Which are stuck? Which utilities are blocking construction? Which sites are ready for trenching, inspection, meter set, or energization? The platform answers the questions builders ask every day.

Consulting

Hands-on utility consulting, end to end.

01

Utility Due Diligence

Existing & required conditions per parcel — electric, gas, telecom, water, sewer, storm, meters, laterals, easements — before they become construction problems.

02

Dry Utility Coordination

Electric, gas, telecom, fiber, undergrounding, service upgrades, meter locations, transformers, conduit routing, pull boxes, and vaults.

03

Wet Utility Coordination

Water, sewer, storm drain, fire service, laterals, main connections, capacity issues, and coordination with civil design and municipal agencies.

04

Joint Trench Planning

Routes, separation, provider participation, sequencing, field readiness, inspections, and closeout. See the full Joint Trench platform →

05

Agency & Provider Management

One coordination point for utility companies, municipalities, public works, building departments, engineers, designers, and subs.

06

Schedule & Critical Path

Utility tasks tied to grading, foundation, paving, inspections, occupancy, meter release, and energization milestones.

07

Field Conflict Resolution

When conflicts surface, we convene the right stakeholders, document the issue, track the decision, and push resolution forward.

08

Closeout & Final Connection

Inspections, sign-offs, as-builts, meter releases, approvals, and energization — no last-minute utility surprises at completion.

The Platform

Ten capabilities, built for multi-parcel rebuilds.

F-01Portfolio DashboardEvery active parcel, status and risk at a glance.
F-02Parcel Utility ProfilesFull wet + dry record for every project.
F-03Utility MatrixWho owns each task, what's still missing.
F-04Priority TrackingParcels ranked by urgency and schedule impact.
F-05Document ControlVersioned plans, permits, photos, as-builts.
F-06Tasks & AccountabilityEvery task owned, dated, and prioritized.
F-07Schedule IntegrationUtility milestones on the construction critical path.
F-08Issue & Conflict TrackingLogged, assigned, visible until closed.
F-09Stakeholder AccessThe right view for owners, PMs, engineers, subs, field.
F-10Leadership ReportingPortfolio risk for owners, lenders, executives.
F-02 · IN DEPTH

A complete utility record for every parcel

Electric, gas, telecom, water, sewer, storm — with service points, required upgrades, permit status, provider contacts, open risks, and the next required action. Wet and dry, one record.

F-04 · IN DEPTH

Know where to focus first, every morning

The platform ranks parcels by urgency, schedule impact, and blocking issues — ready for action, waiting on providers, blocked by design or permits, or approaching milestones that put occupancy and turnover at risk.

1 parcel delayed

Manageable. You absorb it, resequence, and move on.

50 parcels delayed

Staffing, subcontractor sequencing, revenue timing, lender reporting, and delivery all slip together.

1 repeatable system

Requirements identified early, responsibility assigned, approvals tracked, conflicts resolved before field work — on every lot.

The Builder Benefit

More control. More predictability. Better visibility.

One partner for wet and dry utility coordination, one platform for every parcel — so your PMs build instead of chasing utilities.

✓ One partner, wet + dry ✓ One platform, all parcels ✓ Fewer missed applications & approvals ✓ Faster identification of utility risk ✓ Clearer stakeholder communication ✓ Better agency & provider coordination ✓ Reduced rework and field delays ✓ Stronger schedule control ✓ Easier owner & lender reporting ✓ A clear path to final connection

Rebuild faster by clearing the utility path across every parcel.

Rebuild builders need more than utility follow-up — they need a system. Know what each parcel needs, where each project stands, what's blocking progress, and what must happen next.

For Institutions For Commercial

{{ rebuildSub }}

Page view reserved — send over the copy and materials for this audience and we'll design it in.

{{ rebuildSub }} — hero & positioning (content to be provided)
{{ rebuildSub }} — intelligence products (content to be provided)

Venture & Growth Capital · Project Lenders · Insurers · Corporate Real Estate · Economic Development · Research Parks

Know which builds are on track, which are stuck, and what comes next.

A lease may be signed while grid power is two years out. A groundbreaking may make the news while the substation, water, and air permits are unresolved. Hard Tech Intelligence combines consulting, field verification, and a map-based platform to give institutions a live, site-level picture of buildout status, power and utility risk, and project momentum across every advanced-manufacturing facility they touch.

Request an intelligence briefing Watch the scan resolve →

The Institutional Challenge

Institutions decide before the picture is clear.

A fund backs a company whose factory is years from powered. A lender advances a draw before the fab is truly buildable. A developer commits to a delivery date the utility cannot support. Buildout information lives scattered across agencies, builders, permit portals, utilities, spreadsheets, and field notes — and that creates blind spots exactly where hundreds of millions are committed.

which sites are actually moving? stalled builds invisible power constraints hidden interconnection queue unknown builder capacity unknown funding milestones at risk status reports already outdated permits scattered across agencies corridor momentum unclear no portfolio-level view

The Hard Tech Intelligence Hub

One operating picture for facility oversight.

A secure, map-based command center that brings site data, power and utility readiness, agency milestones, builder activity, documents, field updates, and risk indicators into one shared environment — a single source of truth from site selection to operational.

Platform Capabilities

Twelve capabilities, built for institutional oversight.

F-01Portfolio DashboardBuildout momentum across every tracked site.
F-02Site Intelligence ProfilesA structured record for every facility.
F-03GIS Facility MapBuildout seen geographically, not in rows.
F-04Utility Readiness TrackerGrid, water, and gas path to energization, per site.
F-05Institutional Risk ScoringPower, permit, schedule, funding, environmental risk.
F-06Capital Milestone TrackingDraws, equity tranches, and grants tied to real readiness.
F-07Builder MonitoringCapacity, performance, and escalation patterns.
F-08Document RepositoryPermits to commissioning packages, audit-ready.
F-09Field VerificationGeotagged photos and observed conditions.
F-10Executive ReportingBoard-ready summaries and recommendations.
F-11Stakeholder AccessThe right view for execs, risk, field, partners.
F-12API & Data IntegrationFeeds into fund, loan, asset, and GIS systems.
F-03 · IN DEPTH

See buildout the way it actually happens — on the map

Portfolio sites, financed and insured facilities, power and utility constraints, interconnection corridors, and completed builds — layered over the parcel fabric. Institutions see not just their own sites, but the whole hard-tech corridor around them.

F-05 · IN DEPTH

Ten risk categories, one composite score

Power, permit, infrastructure, schedule, environmental, funding, builder capacity, entitlement, commissioning, and documentation risk — scored per site and rolled up per portfolio, so risk teams see which facilities need attention and which are moving normally.

F-06 · IN DEPTH

Capital decisions tied to actual readiness

Loan draws, equity tranches, and grant releases tracked against verified milestones — site verification, power readiness, construction, commissioning, operational. Funds move when the facility is actually ready, and holds surface before they become losses.

Consulting Behind the Software

The platform is half of it. Field expertise is the other half.

Data is only useful when someone knows what it means on the ground. Our consultants verify conditions in the field, coordinate utilities and agencies, and turn platform signals into recommended actions.

✓ Site & portfolio assessment ✓ Facility due diligence ✓ Power & utility capacity review ✓ Infrastructure risk analysis ✓ Utility & builder coordination ✓ Agency coordination ✓ Interconnection & easement review ✓ Field verification & GIS support ✓ Capital readiness review ✓ Incentive & program support ✓ Status reporting & documentation ✓ Executive briefing support

Value by Institution

One picture, read eight different ways.

Project & Infra Lenders

Buildout readiness, draw risk, collateral value, and time-to-revenue.

Insurers & Sureties

Build progress, field conditions, documentation, and completion timelines.

University Research Parks

Spinout and lab facility readiness, power, and buildout risk.

Venture & Growth Equity

Whether a portfolio company's facility will actually be ready on plan.

Corporate Real Estate

Develop-to-suit readiness, tenant timelines, and power delivery risk.

Industrial REITs & Asset Mgrs

Readiness, power risk, and contractor performance across a portfolio.

Economic Development

Which committed investments are landing — and which need help to close.

Public Authorities

Investment coordination, infrastructure sequencing, and program reporting.

Hard Tech Intelligence turns scattered buildout data into decisions institutions can trust.

See which facilities are moving, which are stalled, which are power-ready, which need intervention — and which decisions should happen next.

For Commercial & Industrial Real Estate · Owners · Industrial REITs · Investors · Brokers · Lenders

What will it actually take to make this building work for a hard-tech tenant?

A building can have clear height, floor loading, zoning, and a signed LOI — and still be unable to serve the tenant, because the service capacity, transformer, or ductbank isn’t there. Hard Tech Intelligence gives real estate teams site-level visibility into power capacity, utility risk, and buildout sequencing — from tour to commissioned space.

Request an asset review Watch the corridor power up →

The CRE Challenge

The market data is complete. The power data isn’t.

A broker knows demand, but not service capacity. A lender knows exposure, but not the interconnection queue. An investor sees the basis, but not the transformer upgrade beneath it. And a defense or robotics tenant may be ready to sign while occupancy still depends on power, process water, hazmat clearance, fiber, and commissioning.

service capacity unknown fab TI blocked by base-building power ductbank & right-of-way conflicts permitting & commissioning uncertainty underwriting without a power date corridor capacity unclear delayed lease-up & occupancy investor & tenant reporting gaps power-ready date: unknown

The CRE Hard Tech Intelligence Hub

A buildout command center for every asset.

Building data, service capacity, agency milestones, documents, field observations, and schedule blockers — consolidated per asset and rolled up per portfolio, so leadership sees power readiness the way they see rent rolls.

Platform Capabilities

Twelve capabilities, tuned for hard-tech assets.

F-01CRE Portfolio DashboardEvery asset by stage, blocker, and tenant exposure.
F-02Asset Intelligence ProfilesTenants, permits, capacity, capital — one record.
F-03GIS Market & Asset MapCorridors, capacity, and power-ready zones.
F-04Utility Readiness TrackerWet + dry path from service study to energization.
F-05Power & Occupancy ReadinessFrom service capacity to certificate of occupancy.
F-06Infrastructure Risk ScoringPriority by power and permit exposure, not asset value.
F-07Acquisition Due DiligenceHidden power and utility cost, priced before the LOI.
F-08Capital & Draw MilestonesDraws, TI, and refi tied to real readiness.
F-09Contractor MonitoringAccountability across the whole project team.
F-10Document RepositoryTransaction-grade records, audit-ready.
F-11Stakeholder ReportingInvestors, lenders, boards, tenants — right view.
F-12API & System IntegrationAsset mgmt, lease admin, loan servicing, GIS.
F-05 · IN DEPTH

A shell isn’t ready until it can power the tenant

Service capacity, life-safety, fire access, fiber entrance, ductbank restoration, final utility release, commissioning, certificate of occupancy — tracked as one power-readiness path, with the date risk quantified for owners, tenants, and brokers.

F-07 · IN DEPTH

Diligence that sees below the asking price

Service capacity, required upgrades, entitlement barriers, hazmat and access issues, corridor buildout trends, and coordination complexity — quantified before acquisition, refinancing, or repositioning decisions are made. The price is only a deal if the utility path is in the basis.

Consulting Behind the Software

Field expertise that makes the data actionable.

Our consultants walk the sites, coordinate the utilities and agencies, verify conditions, and turn platform signals into decisions your asset team can execute.

✓ Hard-tech site due diligence ✓ Asset-level infrastructure assessment ✓ Wet & dry utility review ✓ Utility & joint trench coordination ✓ Public right-of-way review ✓ Agency & contractor coordination ✓ Field verification & GIS mapping ✓ Utility conflict identification ✓ Permit & approval tracking ✓ Power readiness review ✓ Capital milestone reporting ✓ Executive briefing support

Value by Stakeholder

Every seat at the table reads it differently.

Owners & Developers

What’s blocking each asset — and the steps to construction, power, or occupancy.

REITs & Portfolio Managers

Portfolio-wide capacity exposure, readiness, and buildout sequencing.

Investors & Acquisitions

Better diligence before buying, refinancing, or repositioning in hard-tech markets.

Brokers

Grounded intelligence for listings, tenant conversations, and corridor capacity analysis.

Lenders

Collateral value, construction readiness, draw risk, and occupancy timing.

Insurers

Documentation and field visibility into buildout progress and infrastructure barriers.

Property Managers

Access, utility service, tenant communication, and site readiness in one view.

Tenants

Reliable power dates, utility capacity, and occupancy readiness.

Hard Tech Intelligence turns scattered buildout data into asset strategy.

Protect value, deploy capital wisely, coordinate utilities, support tenants — and deliver powered space with a date you can defend.

DC PROJECT REVIEW